By Kosta Bolgov

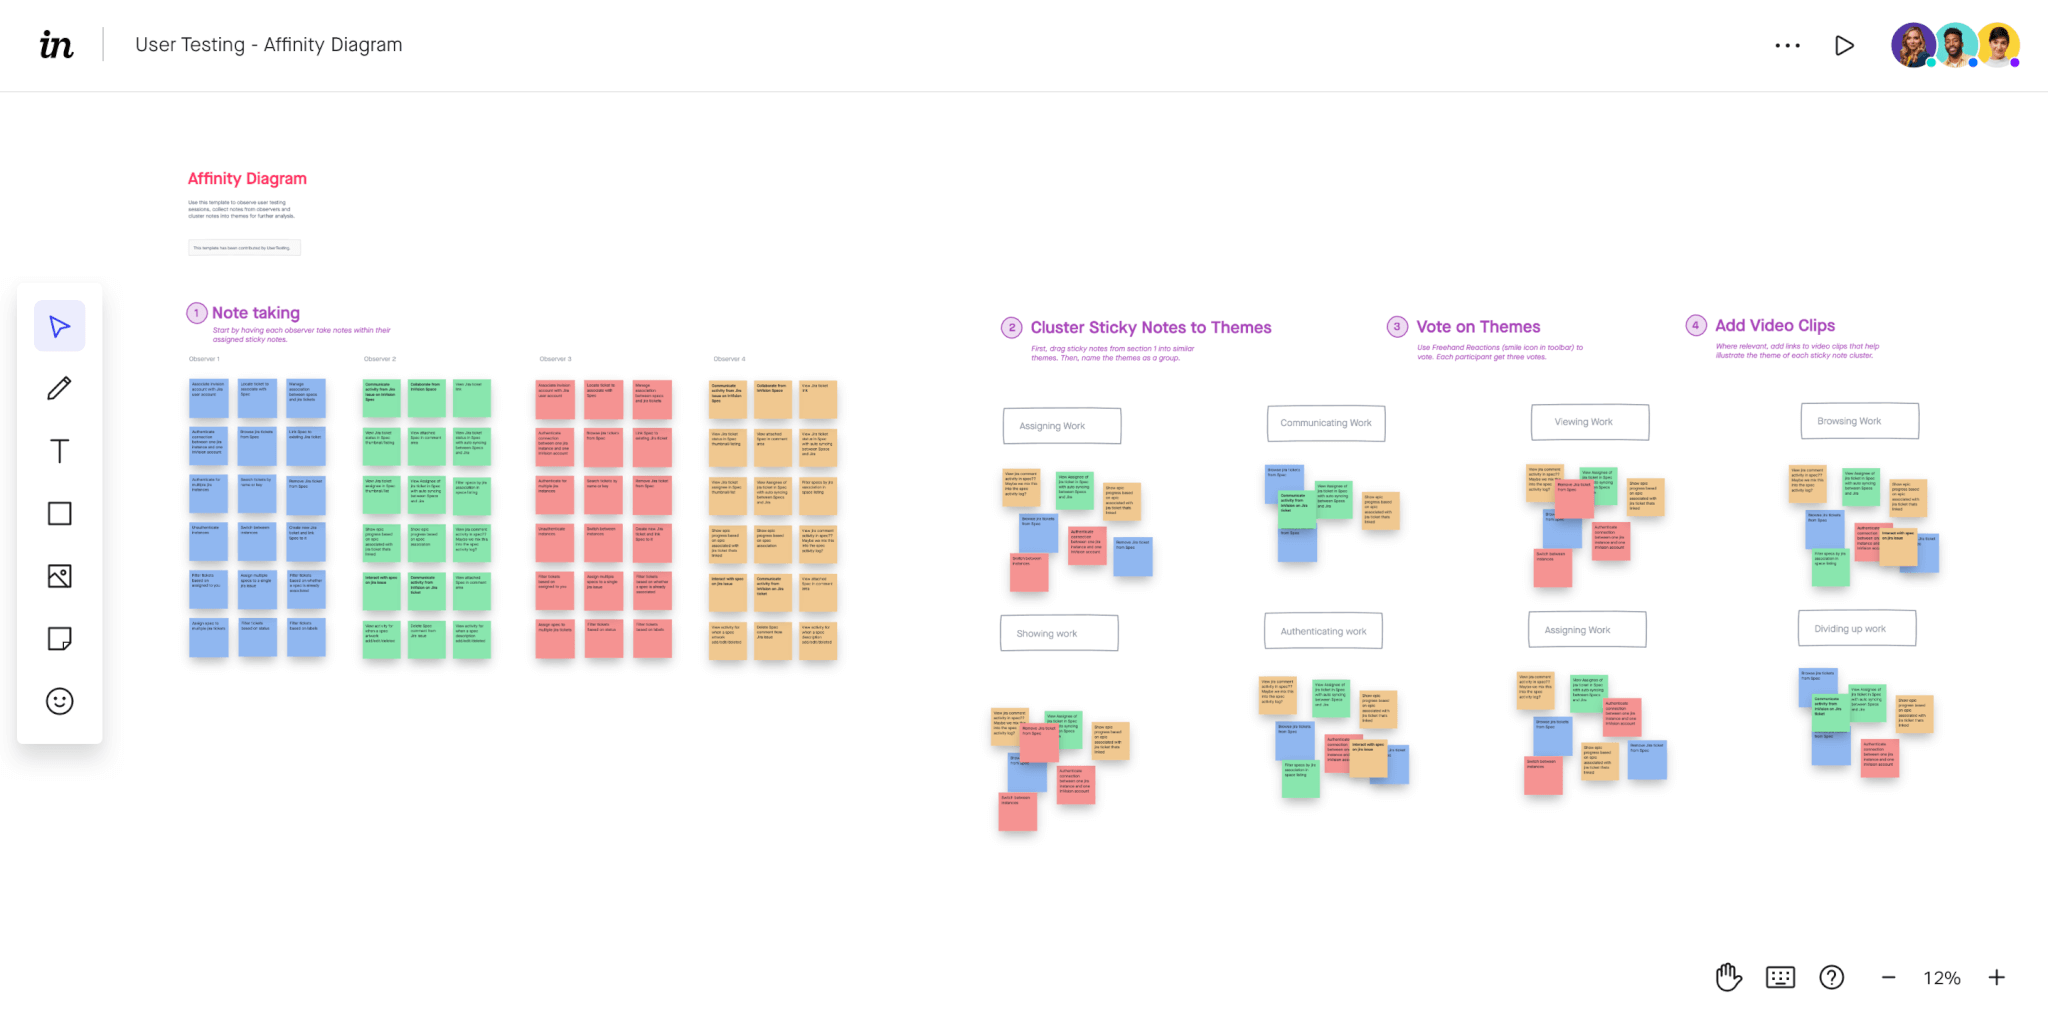
This free affinity diagram template example, contributed by the research experts at UserTesting, will help your team create affinity groupings based on your UX research methods.
Use TemplateLeverage UserTesting’s affinity mapping template to categorize information and find relationships between datasets. You can use this template to transform UX research methods, research session outputs, team brainstorming, or chaotic meetings into categorizable, actionable ideas.
Use UserTesting’s affinity diagram template to:
Bring your ideas to the table by creating a sticky for each data point. Apply the affinity map to any set of information, from user research to brainstorms.
Ask your team to help organize your stickies into groups. Listen to each member of the team make their own connections between the data points. When every sticky has a spot, discuss what makes them similar and name each group.
Using Freehand reactions, vote on each category’s priority, value, and impact on the business.
Add any video, photo, or other content that can reinforce each group’s theme. Add each piece of content to the freehand for reference after your mapping session is complete.
At the end of your session, your team will better be able to synthesize your UX research methods into a more thorough understanding of your data with an easy-to-use affinity diagram template.